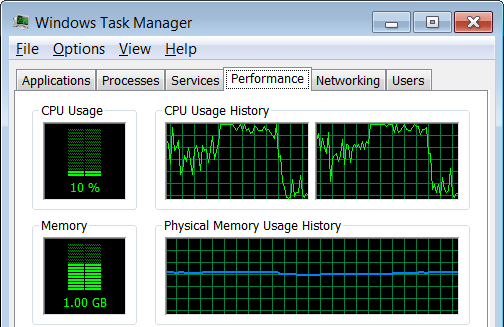
Whenever the computer is lagging or some application is taking too long to respond, we usually fire up task manager and look under the Performance tab or under Processes to check on processor utilization or the amount of free memory available. The task manager is ideal for real-time analysis of CPU and memory utilization. It even displays a short history of CPU utilization in the form of a graph. You get a small time-window, about 30 seconds or so, depending on how large the viewing area is.
However, 30 seconds is rather short to make any meaningful analysis of the performance of a process or the system as a whole. Some users lament that there is no data logging feature in Task Manager to plot CPU usage over a longer time duration. Truth is, the task manager isn’t meant to be used as a performance analysis tool. For this purpose there is another more powerful tool called Performance Monitor. It is a part of Windows and it has the ability to record CPU and memory utilization and a host of other parameters for a long period of time.
To launch Performance Monitor, press Win+R on your keyboard and in the Run dialog box type perfmon and press Enter.
To get an immediate and real-time view of CPU utilization, click on Performance Monitor on the left-hand Console Tree. The color scheme of the graph is different (red over white), but it is the same graph you can see under Task Manager.
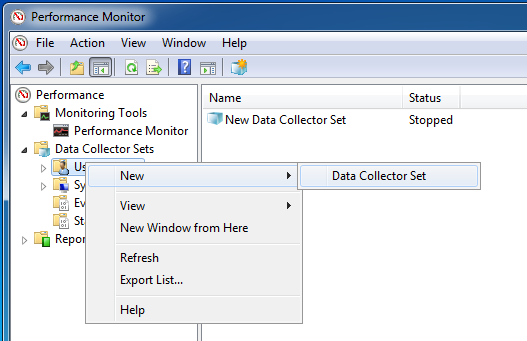
To enable logging you have to create a new Data Collector Set. On the navigation panel on the left, expand Data Collector Set and right click on User Defined. From the New menu click Data Collector Set.
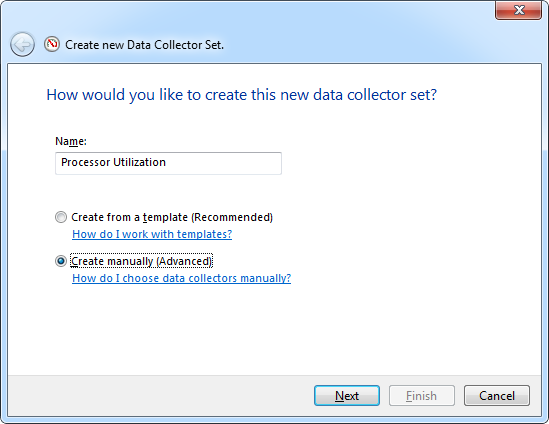
Give a name to the set that you can recognize later, and choose the radio button Create manually. Click Next.
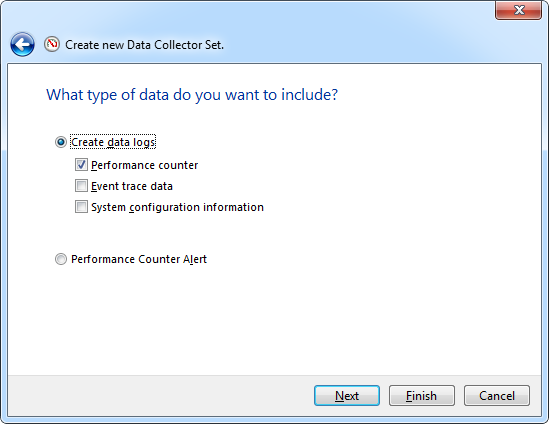
Under type of data, choose Create Data Log and check the box Performance counter. Click Next.
Here I want to add a quick note on the different types of data log available and what each of them does.
- Performance counters are measurements of system state or activity. This option polls the requested parameters at specified time intervals and records the data returned.
- Event trace data only logs the event when something happens. The data is collected from trace providers, which are components of the operating system or of individual applications that report actions or events.
- Configuration information is collected from key values in the Windows registry. Windows Performance Monitor can record the value of a registry key at a specified time or interval.
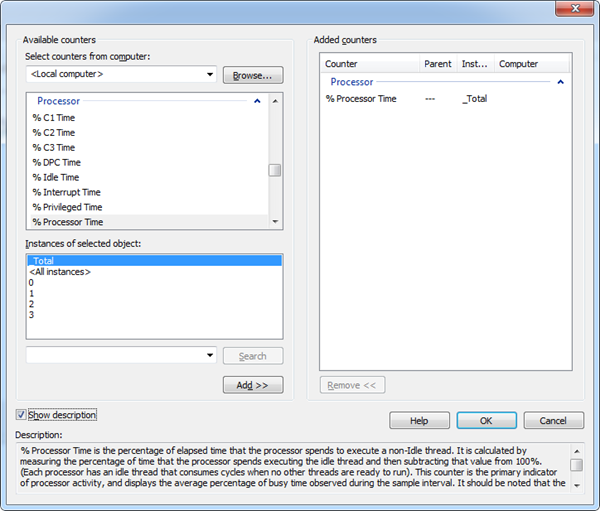
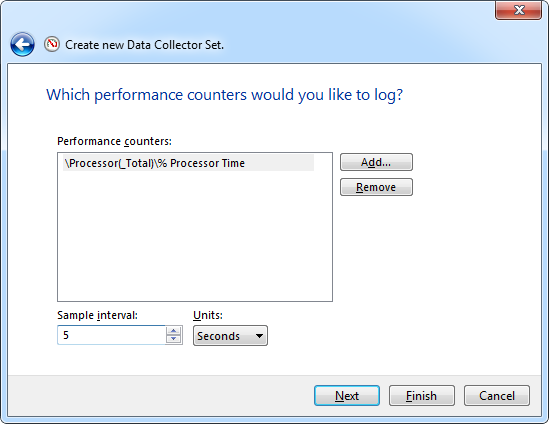
Now is the time to choose the performance counters which you would like to log. Click on the Add button and choose one of the many available counters. You can log processor utilization, processor idle time or interrupt time, memory usage, USB activity and dozens of other counters. In this example, we chose Processor Time.
Adjust the poll interval. 5 seconds should do.
At this step, you can either click the Finish button or progress though the next few steps where you can specify the location of the log file or configure the Data Collector Set to run as a specific user.
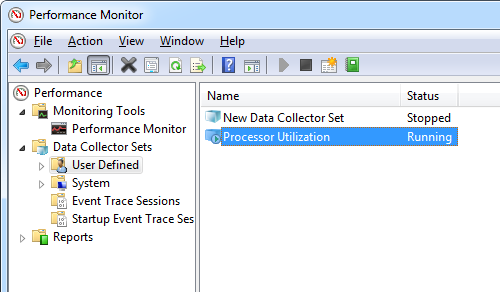
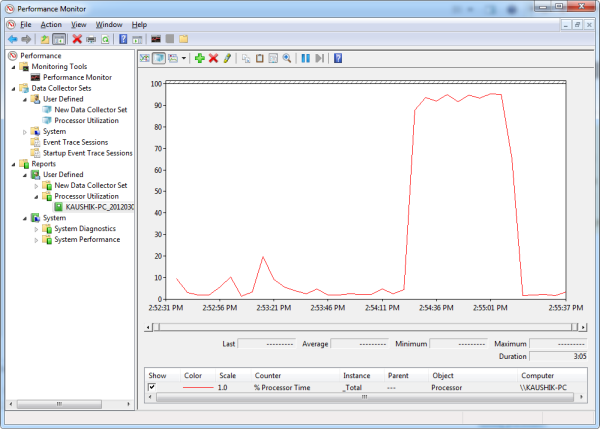
Once the data set is created, run it. The Data Collector Set will start recording data from the chosen performance monitor, in our case, CPU utilization. Reports aren’t available when the data set is running. After you stop it, you can see your report under the Reports directory in the navigation panel.
Here is our CPU utilization graph recorded over a period of 3 minutes.
Aside from CPU utilization you can record memory usage, disk activity, network activity, system events, and several other things.




0 comments: